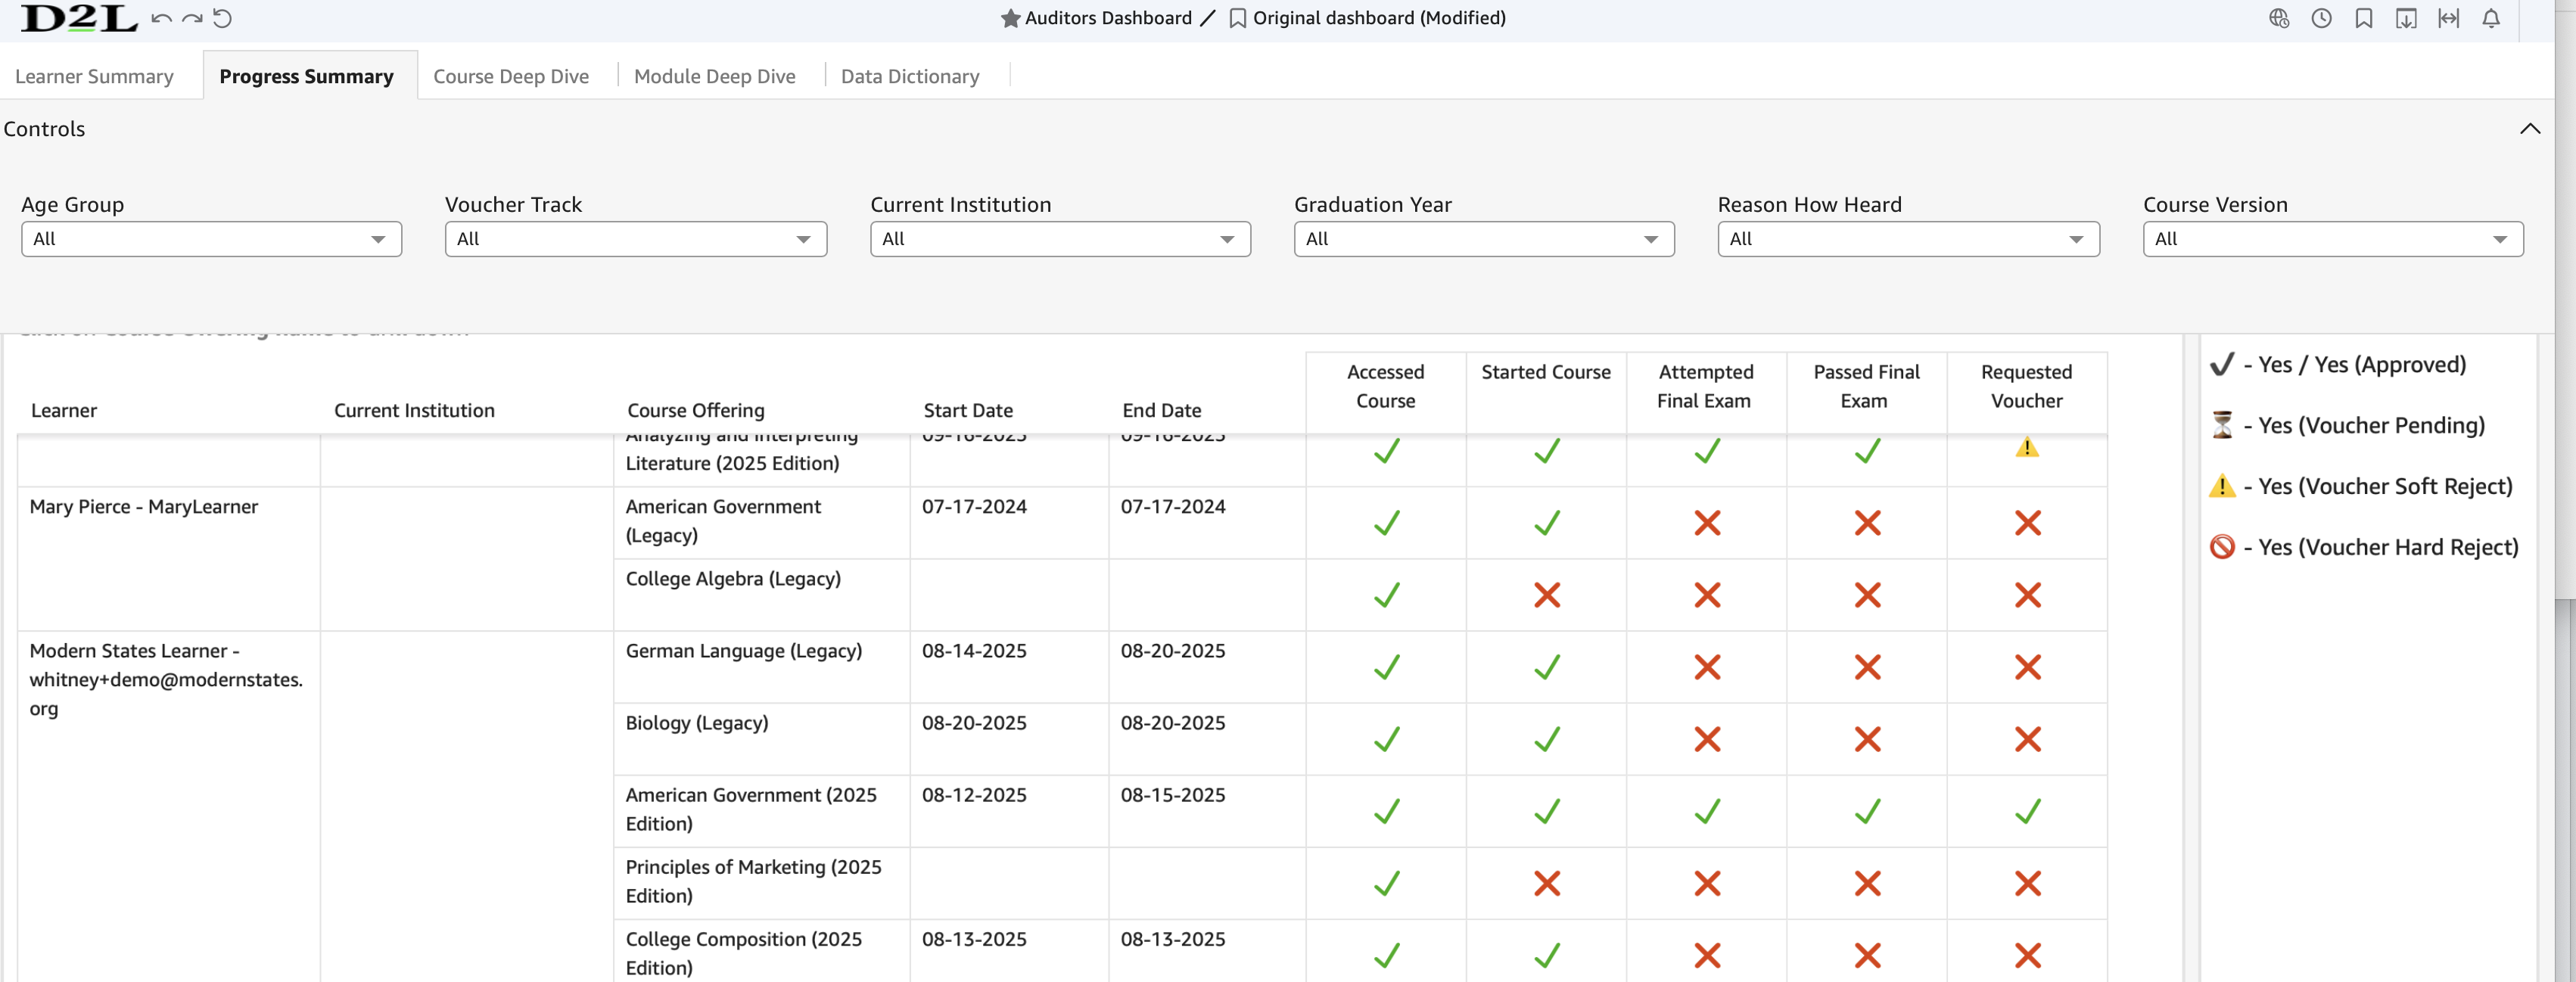
Auditors Dashboard/Progress Summary
Which courses are my students studying and how far have they progressed?
Click on a course title for all filtered courses and learners in the right hand chart on the page for this tab, Auditors Dashboard/Progress Summary, to see a deep dive into that course’s details.

Auditors Dashboard/Milestones At A Glance
At the student level, what key progress milestones have my students completed in each enrolled course?
See all learner milestones at a glance for all filtered courses and learners in the middle chart on the page for this tab, Auditors Dashboard/Progress Summary.
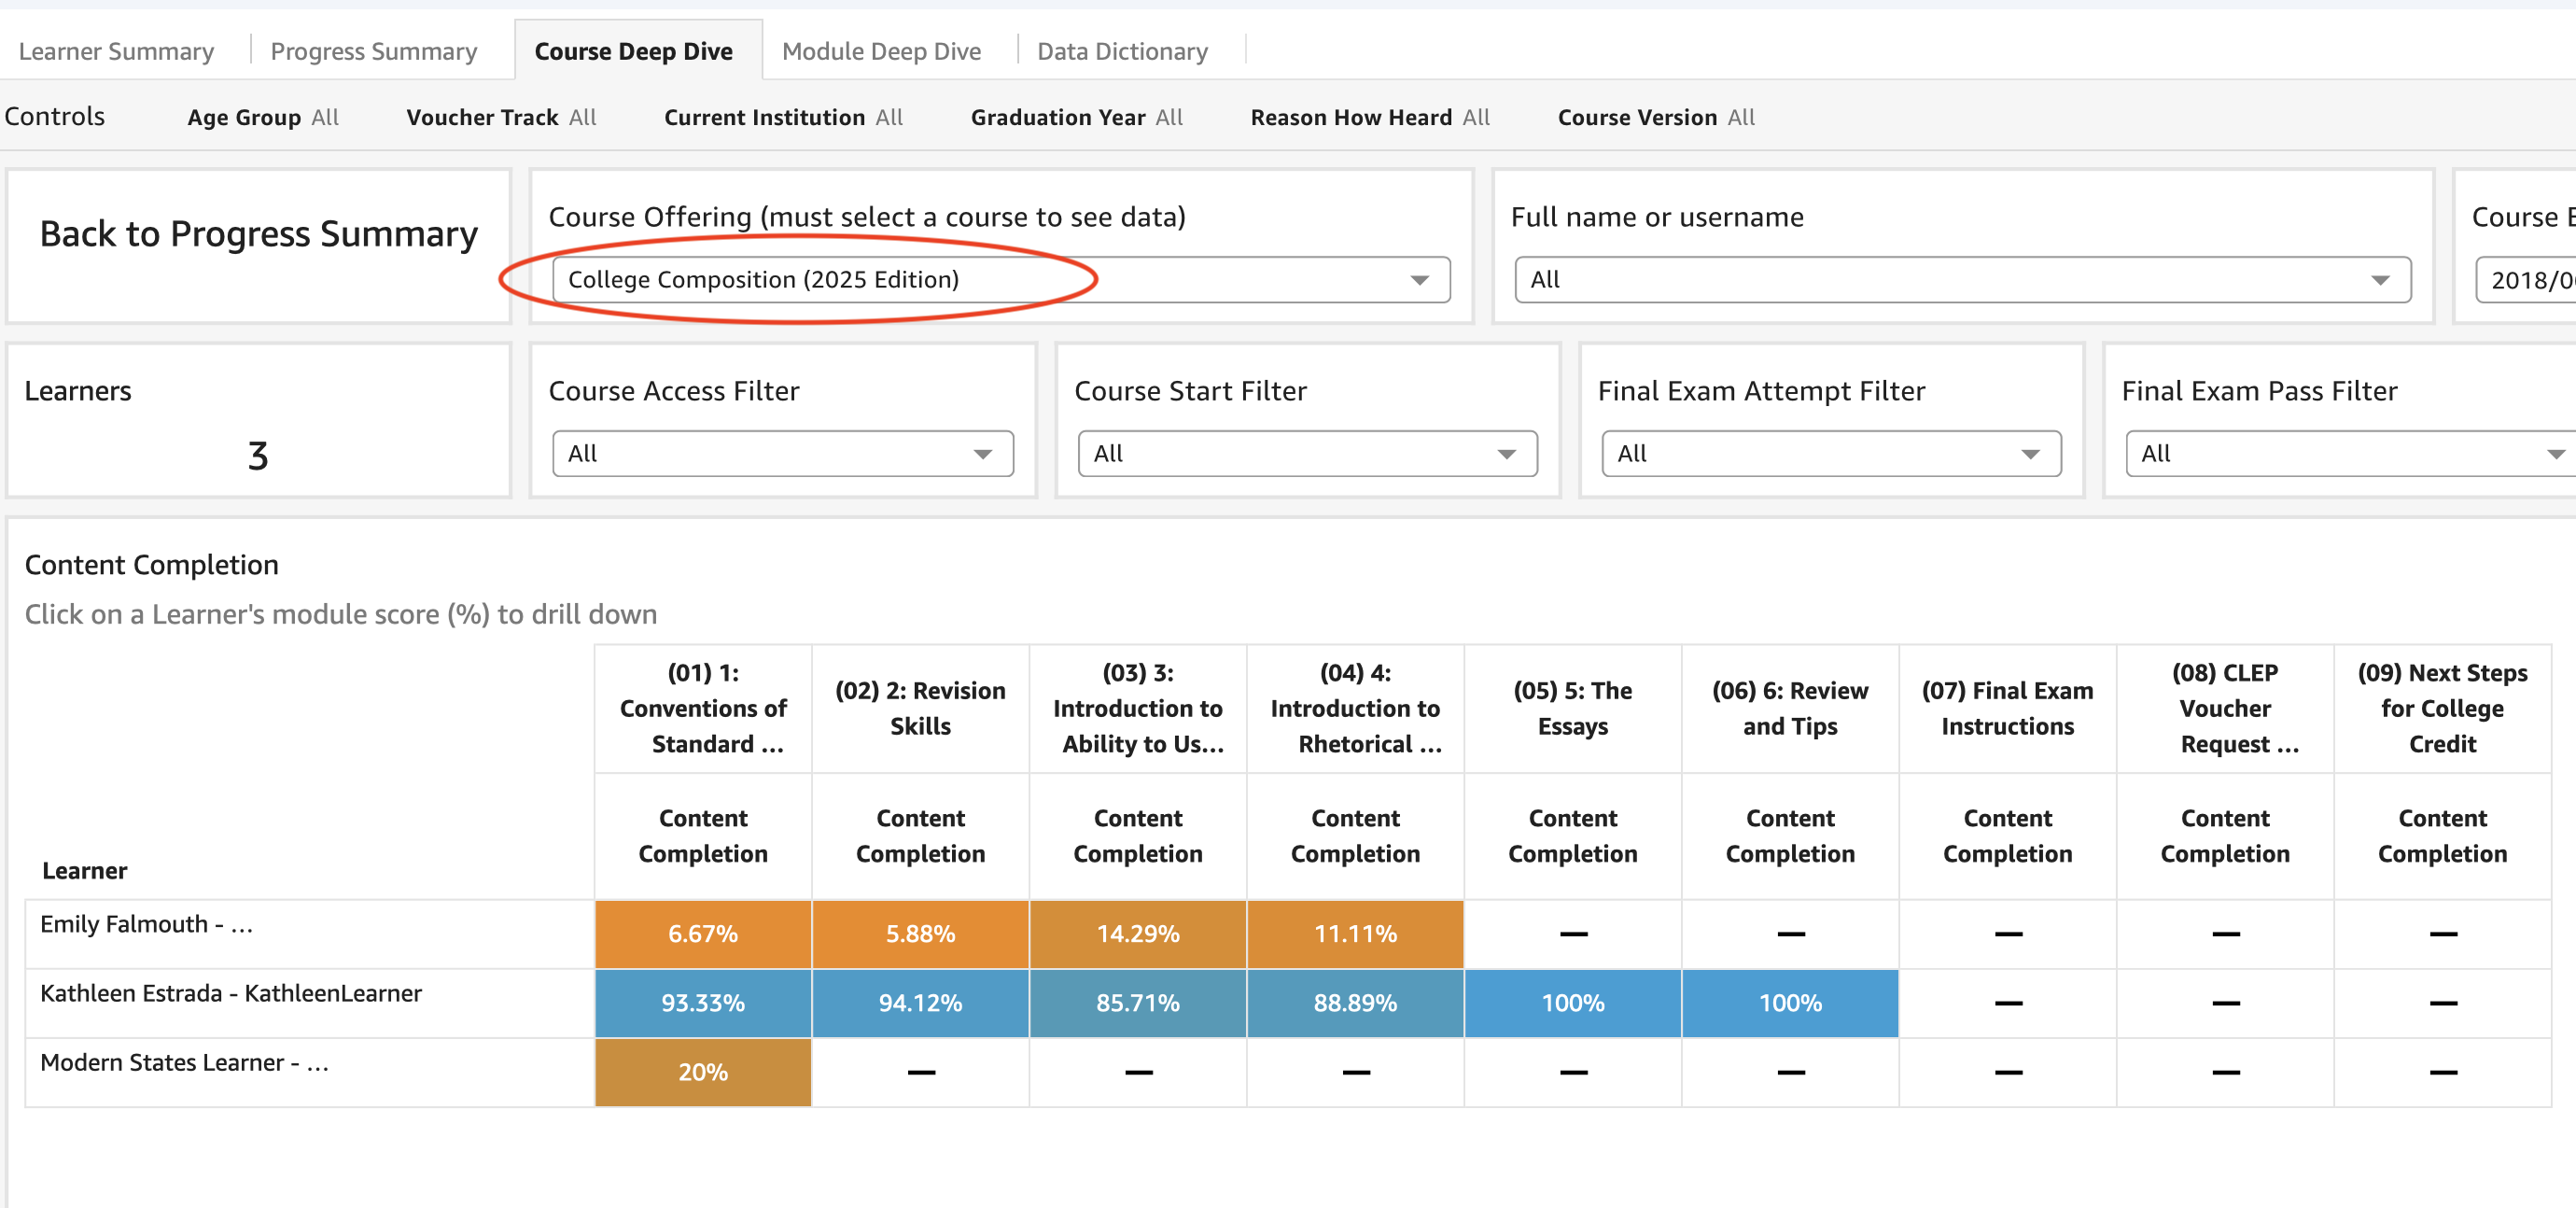
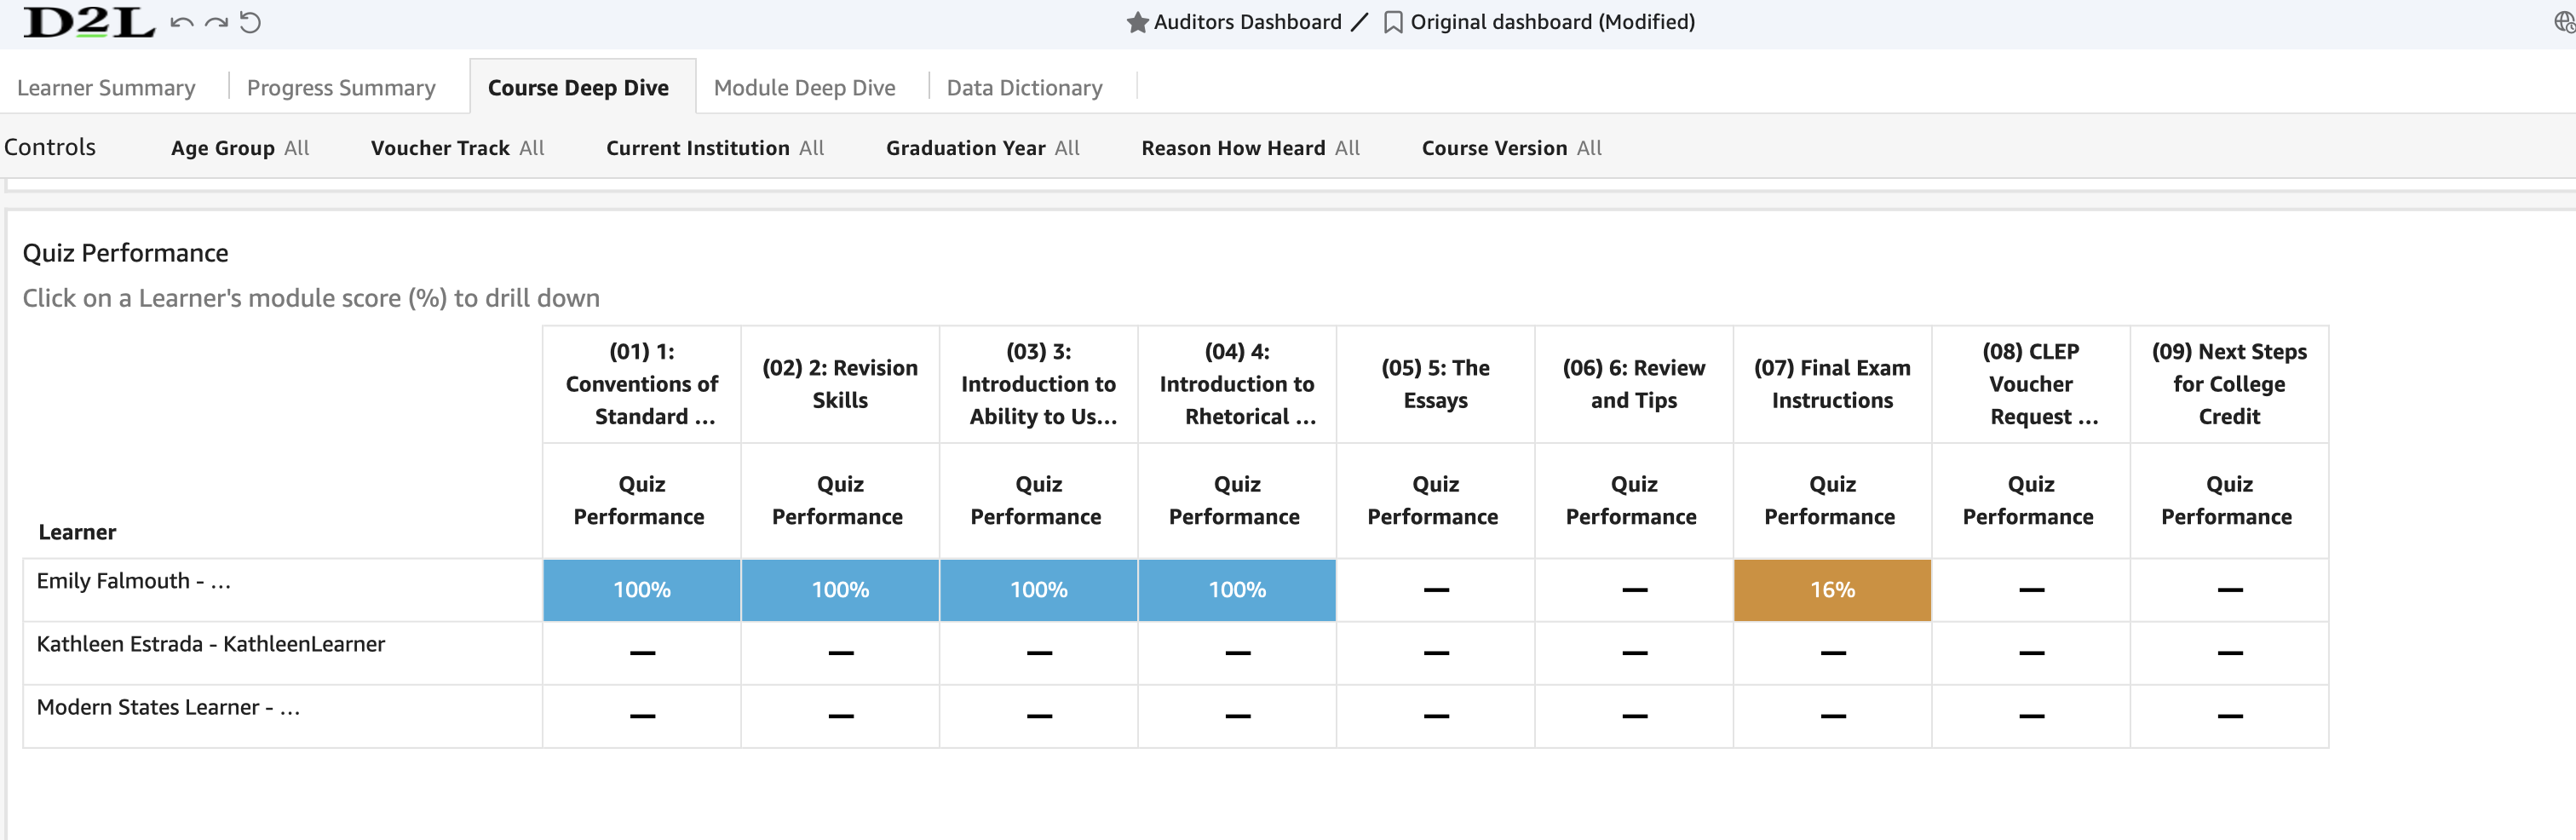
Auditors Dashboard/Course Deep Dive
After clicking as seen above in the Progress Summary, Auditors Dashboard/Course Deep Dive tab will open to see a deep dive into that course’s details.
You’ll see heat maps in two charts, Content Completion and Quiz Performance. The colors of the heat maps are shades of blue for percentages of 75 and above and shades of orange for percentages of 75 and below. Below those two charts is Time in Content (in minutes), the third chart showing Course Deep Dive details.
Within each course, where are learners spending their effort and how are they performing?

Support and Resources
Click here for our knowledge base
Click here for further assistance
|
Was this article helpful?
That’s Great!
Thank you for your feedback
Sorry! We couldn't be helpful
Thank you for your feedback
Feedback sent
We appreciate your effort and will try to fix the article